Lead Quality vs. Lead Quantity: Why B2B Teams Are Rethinking Their Funnel in 2026
Bigger buying committees and tighter budgets are forcing B2B teams to rethink lead quality vs. quantity. Here's how top teams rebalance the tradeoff in 2026.
Updated September 3, 2026

Churn starts before a customer cancels. They log in less, take longer to reorder, or stop opening your emails. By the time they officially leave, the warning signs have often been there for weeks.
This article covers how to spot those signs early, identify which ones actually predict churn, flag at-risk customers, and respond based on why they're pulling away.
You can build a working churn-detection system in a few weeks using data you already have.
Looking for a Digital Marketing agency?
Compare our list of top Digital Marketing companies near you
ProfitWell found customer acquisition costs rose by more than 60% over five years across key sectors, eroding ROI even for companies growing top-line revenue. Some niche segments stand out as exceptions.
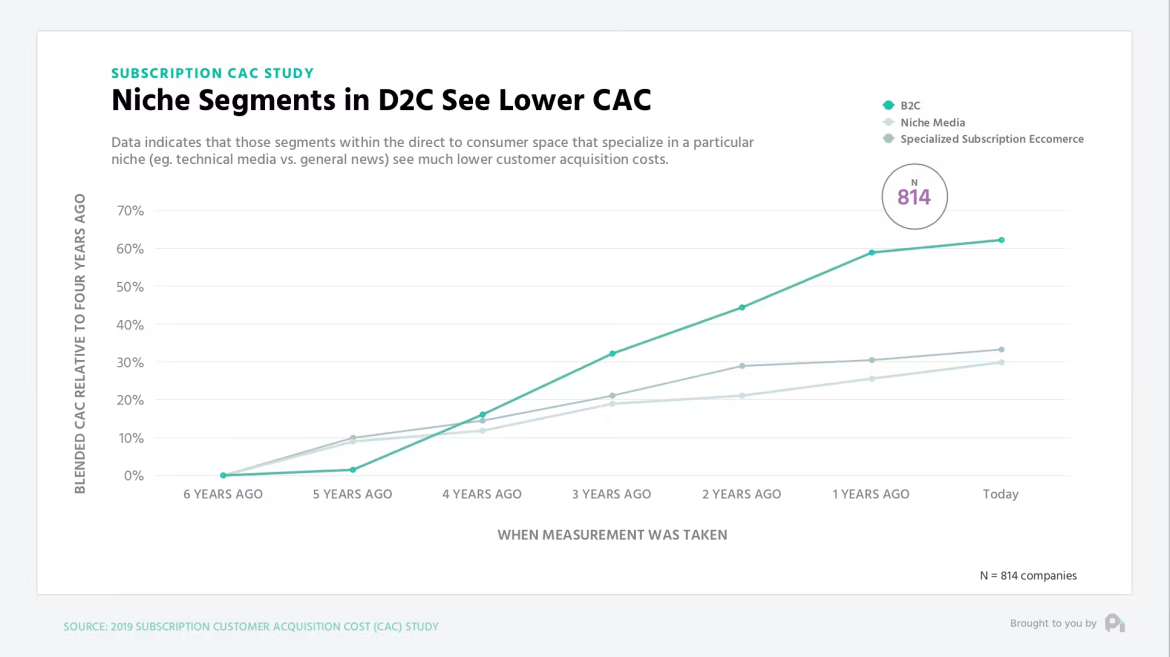
So the cost of replacing a customer you lost has gone up faster than the value of that customer. Every point of churn is more expensive to paper over than it was three years ago, and the papering-over is invisible in your reporting because gross revenue looks fine while net retention quietly rots.
The counterweight is well documented.
Research indicates that improving customer retention by as little as 5% can boost profits anywhere from 25% to 95%, according to Harvard Business Review. A five-point improvement is not a transformation program. It is usually a few hundred customers a year who would have left and didn't.
The cancellation is often the only step most companies measure, which is why churn feels sudden and unpreventable when it's neither.
Before someone leaves, they use you less.
For a SaaS product, the seat count stays the same but weekly active users inside the account drop from nine to three, and the three who remain only touch one feature.
For an ecommerce brand, the reorder window stretches from 34 days to 51 days to nothing. For a services firm, the client stops looping in their own team on the shared thread and starts replying only to invoices.
The same pattern shows up in longer, higher-consideration services such as bathroom remodeling in Tampa, where a homeowner mid-project who stops responding to update calls or delays approving change orders is signaling dissatisfaction well before a review or churn is visible.
None of these show up in a churn report. All of them show up 30 to 90 days before the churn report.
Deven Patel, Founder of Role, runs a job search engine sourced directly from employers, so early disengagement signals matter even more when trust in listing quality is the product's core promise
"The account still being there is what fools people. Someone can look active on paper while their behavior has already changed, searching less often, opening fewer listings, going a week between visits instead of a day,” says Patel. “That drop happens long before anyone deletes anything. If the only thing you track is whether the account exists, you find out at the very end. If you track how deeply people are using the product, you find out while there is still something you can do."
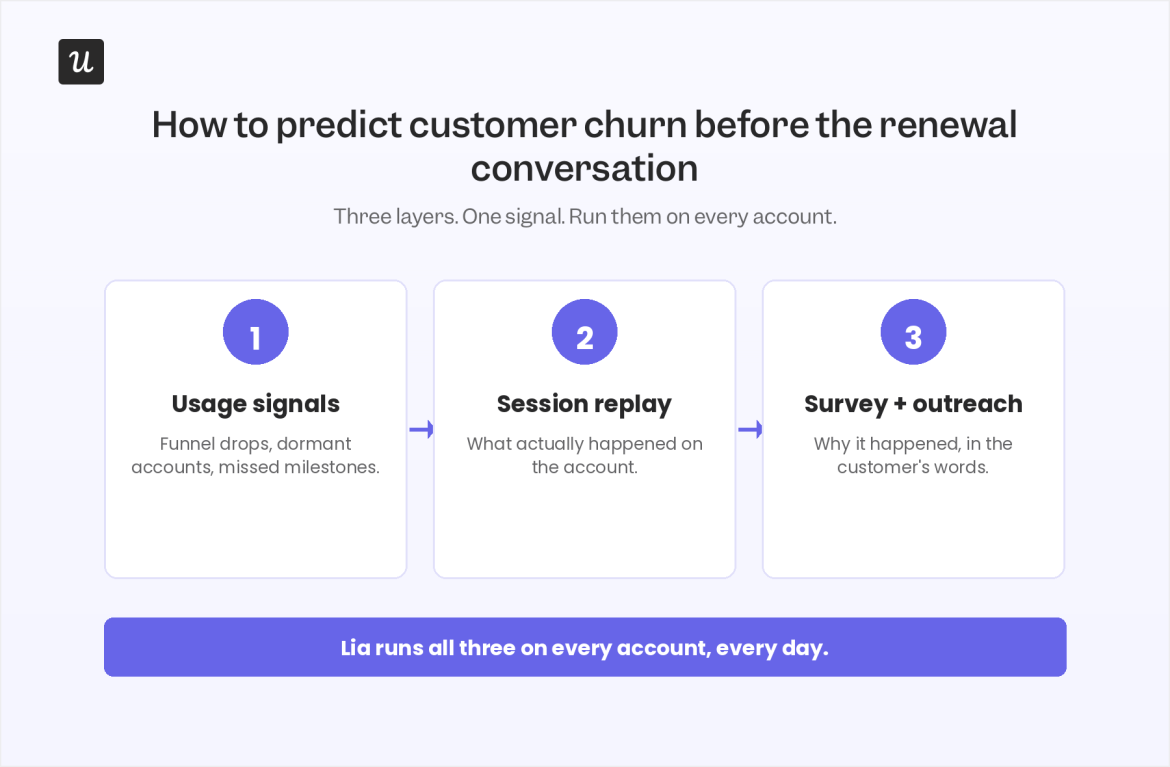
You do not need a new data warehouse to start. You need a single, clear view of who your customers are, what they did last, and when.
The dependency that actually blocks teams is fragmentation: support has one version of the customer, billing has another, and product analytics has a third.
Unify enough of it in your CRM or CDP that marketing, product, and support are looking at the same timeline. Then build lifecycle cohorts and measure movement between them, because movement is the leading indicator and totals are the lagging indicator.
This is the part worth spending real time on. Everything downstream depends on it, and most teams get it wrong by making it too clever.
These signals need to be:
A usable set for a subscription product might be: days since last core action, decline in weekly active users within the account, and an unresolved support ticket older than five days.
For e-commerce: days past the expected reorder window, drop in email engagement across two consecutive campaigns, and a return or delivery failure in the last 60 days.
Validate them backward before you trust them forward.
Take everyone who churned in the last two quarters, look at what their behavior did in the 90 days before, and see which signals actually moved. Half of what you assumed will not survive that exercise. The two or three that do are your model, and a simple model you act on beats a sophisticated one nobody looks at.
Rankings produce a list that's always the same length and always feels like homework. A threshold produces an empty queue.
Be honest about capacity here. If your CS team can meaningfully reach 20 accounts a week, tune the threshold so it flags roughly that many accounts. A system that generates 400 alerts that nobody can act on is worse than no system, because it teaches everyone to ignore the alerts.
A dashboard is where alerts go to die.
Push the flag into the tool that the responsible person already opens every morning: a Slack channel, a task queue, a CRM view pinned to their homepage.
Attach context to the flag itself. Which signal tripped, what the account's last three interactions were, what they bought or used most, and who owns the relationship. If the person receiving the alert has to go research the account before they can act, the alert will sit for four days, and by then it's a churn report again.
Here's where a lot of retention programs go sideways. The flag fires, and the response is a message.
Often, the right response is not a message.
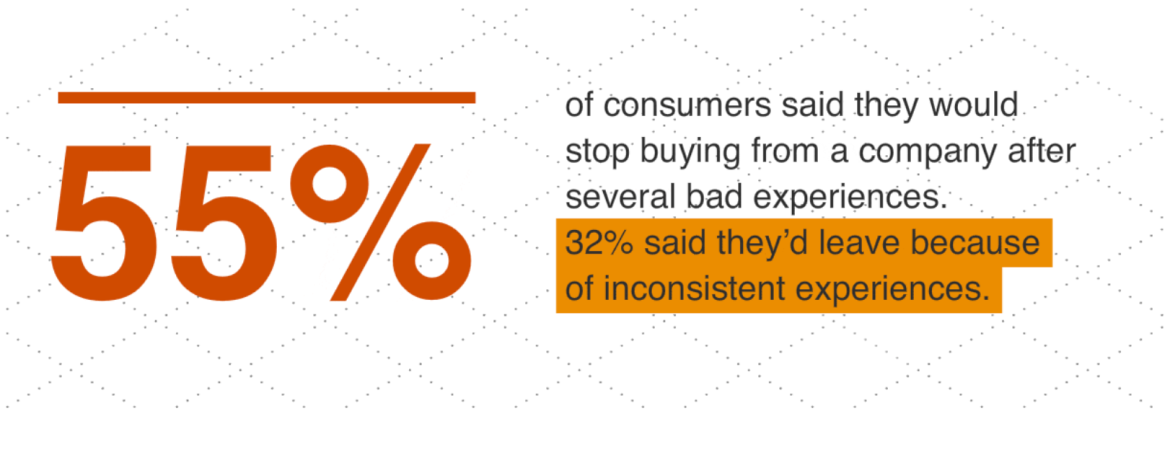
PwC found that 55% of customers will walk away from a brand they love after just one bad experience, which means a meaningful share of your at-risk queue is at risk because something broke: a shipping delay cluster, a discount policy that punishes loyal buyers at exactly the wrong moment, or an onboarding step where people stall and never recover.
Sending those customers a re-engagement email confirms that you weren't paying attention.
So build a triage step into the flag.
Before anyone sends anything, someone checks: Did we do something to this account? Look at tickets, delivery exceptions, billing changes, failed payments, and feature deprecations.
When the answer is yes, the play is a fix and an acknowledgment, in that order, and the acknowledgment should be specific enough that the customer knows a human read their file.
The patterns you find here are usually structural rather than individual. One shipping lane, one policy, one confusing screen, generating a hundred at-risk flags a quarter.
Andrew Bates, COO of Bates Electric, has experience overseeing service operations where customer retention depends heavily on what happens before, during, and after the job.
He notes, “When several customers start raising the same concern, treating each one as an isolated service issue only gets you so far. You have to trace it back to the process. It could be scheduling, communication, response times, or the handoff between teams. Fixing that underlying problem prevents the next ten customers from having the same experience in the first place.”
Fixing it is worth more than any campaign you'll run this year. UX and service design partners are useful when you need someone to map the journey and test the fix rather than argue about it internally.
The default win-back is a discount sent to everyone with an urgent deadline. It works occasionally and trains everyone else to wait for the discount.
Better is boring and specific: reference what they actually used or bought, address the reason they slowed down if you know it, and make the next step small.
Someone who stopped using one feature after a workflow change needs a five-minute walkthrough, not 20% off. Someone whose reorder window lapsed after a delivery failure needs the delivery fixed and a make-good, not a newsletter.
The evidence for relevance is not subtle. Epsilon found 80% of consumers say they're more likely to buy when brands offer personalized experiences, and McKinsey's work shows companies that excel at personalization generate 40% more revenue from those activities than average players.
Practically, that means lifecycle over blasts:
Clutch's email marketing and marketing automation directories are a reasonable starting point if you need someone with an industry-specific playbook rather than a generic drip-build.
Loyalty programs are a frequency and margin lever, and they reward people who are already staying.
If you run one anyway, tie the rewards to behaviors that correlate with retention in your data, and check redemption rates honestly. Points nobody redeems are a liability on your balance sheet and a shrug in your customer's inbox.
Harvard Business Review has a good breakdown of why most programs miss and what changes when they're designed around status and access rather than discounts.
People complain publicly before they complain to you.
Treat social listening as an input to your at-risk system, not just as brand monitoring. A customer posting a frustrated question about your product on a Tuesday is a flag, and the response time on that reply is a retention metric.
The Sprout Social Index continues to show that responsive, human brands earn more trust and consideration over time. Some teams run this in-house, some hand the monitoring cadence to a social media agency, but what matters is that what gets found there ends up in the same queue as everything else.
Feedback that doesn't visibly change anything is worse than not asking, because you've now confirmed that telling you is pointless.
Omer Reiner, Founder of Texas Home Buyers, works directly with homeowners navigating property sales where uncertainty and poor communication can quickly undermine trust.
He shares, “Customer feedback is most useful when you can connect it to a specific part of the experience. If several homeowners are confused by the same step or asking the same question, that's telling you the process needs work. Changing that step and communicating more clearly is far more valuable than simply collecting another positive or negative review.”
Keep the collection light: a two-question post-purchase survey, an in-product poll at a moment that matters, and structured exit interviews with churned accounts, which are the highest-value and least-used research asset most companies own.
Then run a weekly ritual where someone reads last week's feedback, categorizes the reasons for churn, and picks one thing to change. Harvard Business Review has written well on the pitfalls that cause companies to sit on feedback they've already paid to collect.
Tell the customers who raised it when you ship the fix. That single email does more for retention than most campaigns.
Keep it short enough that people actually look at it.
Repeat purchase rate or logo retention by cohort. Net revenue retention. Time-to-value for your core action. Customer lifetime value against payback period.
Churn reasons, categorized and trended, not just counted. And the two that tell you whether the system itself is working: how many at-risk flags were actioned within your target window, and what percentage of flagged accounts were still active 90 days later.
That last number is the one to present to leadership. It's the closest thing you'll have to revenue you can attribute to noticing.
Pair the scorecard with a monthly test cadence and one metric everyone agrees is the North Star. Amplitude's North Star Framework is a practical guide for picking it. Analytics specialists on Clutch can help with instrumentation if the blocker is that nobody trusts the current numbers, which is a more common blocker than anyone admits.
Pull a list of all accounts or customers that haven't taken your core action in 30 days. Don't build anything, don't wait for the data project, just pull the list.
Read the first twenty by hand. You'll find three or four you can save with a phone call, and you'll find a pattern in the rest that tells you exactly which signal to automate first.
That list is next quarter's revenue, and it's already sitting in your database.