
Why Salesforce Staff Augmentation Is Becoming a Strategic Choice
Salesforce staff augmentation is no longer a stop-gap. Learn why more businesses now use external specialists to access expertise, move faster, and scale...
Updated August 28, 2026

Data-driven business decisions are choices made on the basis of verified data and analysis rather than intuition or assumption. Companies that build a structured approach to collecting, preparing, and analyzing data consistently outperform those that rely on gut instinct alone — across revenue growth, customer experience, and operational efficiency. This guide covers why data-driven decisions matter, where they create the most value, and the five steps to building a business that makes them consistently.
Despite the many challenges, companies of all sizes can leverage data to improve how they make decisions.
According to a 2017 Experian report, data unleashes a wide range of opportunities: improved customer service, risk assessment and mitigation, increased revenue, and more.
Looking for a IT Services agency?
Compare our list of top IT Services companies near you
The majority of companies use data to increase revenue (61%) and provide better service to their customers (56%). The range of benefits is diverse and presents even more opportunities for business.
As the volume of data and interest in data analytics grows, new business cases for investing in data analytics are emerging in many industries.
Companies struggle to extract the full value from available data assets for 4 key reasons:
Overcoming these challenges allows companies to successfully leverage their data and use it to drive profit and growth.
Businesses can use data to drive profit and growth in many areas:
By studying real-life cases of successful data analytics and visualization, you can identify areas where your business can leverage data, too.
Performance data is information coming from digital tools — mobile apps, physical products, or human-provided services — that companies can use to monitor effectiveness, identify weaknesses, and find optimization opportunities.
Feed.fm, a SaaS audio platform serving companies like Fitbit and Shazam, uses real-time and historical performance data to improve its own services and give clients visibility into customer behavior. The company tracks session length, playback frequency, and media augmentation metrics, then correlates these variables to understand what drives engagement and conversion.
The result: Shazam used Feed.fm's audience insights to improve user experience and achieve sessions 5 times longer than before.
Performance data gives companies the evidence to redesign products and services based on how customers actually use them — not how they were assumed to.
User data has tremendous potential to improve every customer-focused industry, from retail to manufacturing and healthcare. As social media and online services generate more behavioral data, the ability to make decisions based on actual customer behavior (rather than surveys or assumptions) has become a competitive differentiator.
Virtualitics helps clients better understand their customers and users through data-centric tools for 3D data visualization in VR and collaborative analysis for shared virtual spaces. Additionally, Virtualitics uses advanced analytics based on machine learning (ML), defined as analytics performed by machines automatically based on statistical techniques and self-learning with data, immersive data experience.
Using an immersive digital environment, 3D data visualization, and ML-based data analytics, Virtualitics generates dozens of insights on buyer behavior within minutes and identifies correlations out of hundreds of variables known as customer characteristics.
As a result, Virtualitics’ tools allow companies to extract complex insights based on their customers’ actual behavior, while showing these correlations in a clear, easy to understand format.
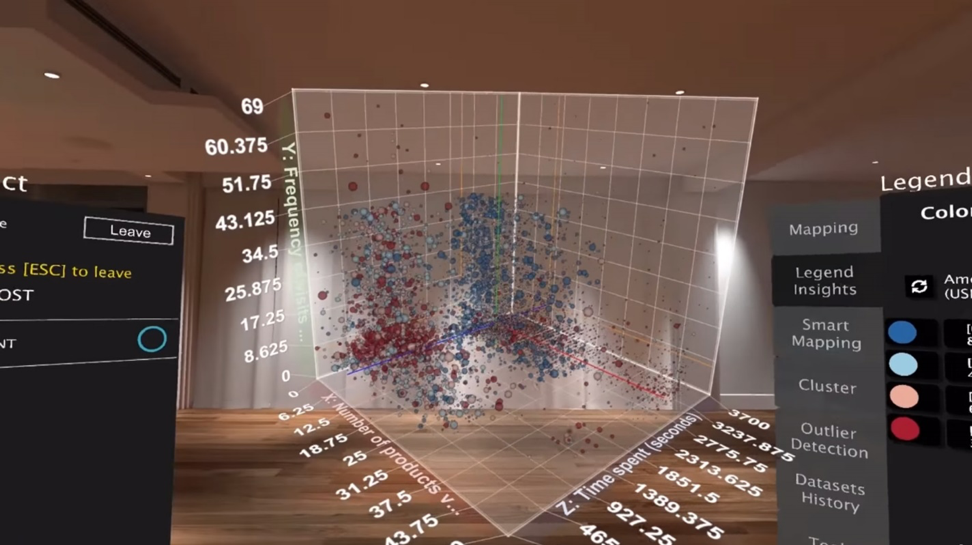
Image credit: Virtualitics
This image demonstrates 3D visualization of customer data insights in a virtual office.
Emerging tools for data visualization and analytics allow companies extract more value from their data and therefore make a bigger impact.
By using data-rich technology and predictive analytics, companies can improve operations, increase efficiency, and reduce maintenance costs.
Global delivery company UPS pioneered the practice of using sensor-based technology to gather operations data. CTO Juan Perez shared the impressive results of UPS’s innovation strategy at IoT World this year and demonstrated how the company enabled serious cost reduction thanks to IoT and data analytics investment.
Today, all the processes at UPS are connected into the same data analytics infrastructure. Trucks, drivers’ handheld devices, bulkheads, and every package are equipped with sensors that continuously send data on what’s happening on the line.
Data analytics allows UPS to optimize drivers’ routes, monitor parcels, maximize packaging, and prevent and reduce breakdowns or losses. In the end, this data-centric initiative brings UPS $50 million in savings every year and is expected to deliver even better results in the future.
This approach can be applied to the operations in different fields, from complex manufacturing at the factories to managing energy consumption at the office or inventory in the supply chain.
Investing in data-rich connected systems allows businesses to reap viable financial returns.
Telemetry allows companies to measure performance and conditions. Additionally, telemetry enables companies to retrieve valuable data from devices and basically any access point remotely. More companies depend on telemetry to monitor different systems, from power consumption to IT system health.
Companies store and manage assets including customer data, accounting reports, operation records, and transaction history. Relatively few, however, proactively think about security and maintenance.
Any malfunction in an IT system can lead to undesirable results, such as loss, theft, or modification of data.
Applixure, a Finnish data analytics platform, helps businesses keep their IT systems healthy. Applixure’s platform collects performance data from hardware and software, providing visualizations of the whole PC environment to provide real-time analytics of what’s happening within the given IT system.
Once Applixure indicates any malfunction or overload, it immediately provides warnings to prevent breakdowns and fallouts.
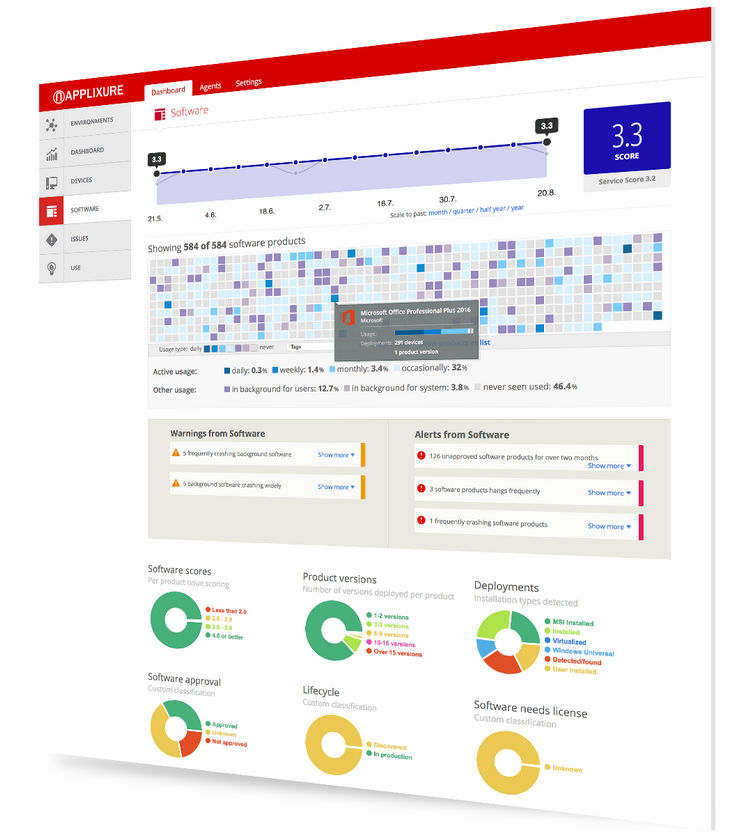
Image credit: Applixure
This image illustrates an Applixure dashboard showing the basic parameters of software monitoring.
Companies can use data analytics to preserve their IT system health, cybersecurity, and sustainability. Companies can also reduce maintenance costs and improve efficiency by using data insights from in-house digital infrastructure.
Businesses can improve their ability to collect and analyze data in 5 steps:
Building data infrastructure includes a set of initiatives, such as assigning data ownership, roles and leadership able to manage corporate data.
Additionally, data infrastructure requires setting data-related processes and adopting relevant technology for data security, monitoring, visualization and analysis. As a result, the quality of data infrastructure determines the maturity of data management in the company.
This image demonstrates how the development of data infrastructure impacts the maturity of data management in the company.
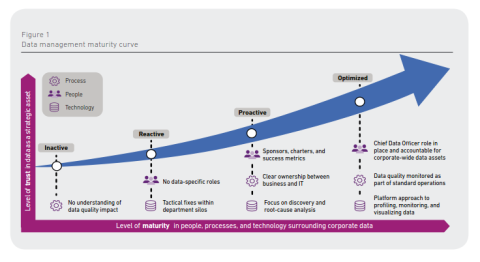
Image credit: Experian
The graph shows the path from inactive to optimized enterprise and how improving data infrastructure impacts the trust in data assets within the company.
Therefore, setting data infrastructure is an important first step that builds the foundation for further data initiative.
A company can define its data strategy when it has data infrastructure – responsible leadership and data professionals able to create a tactical approach. At the next step, data executives and decision-makers assess a company’s potential, identify goals, analyze market, competition, technology, and available data assets and resources.
For example, the previously mentioned UPS initiative identified its goals and put improving efficiency and cutting cost in the center of its data initiative. It determined further digital transformation that brought the company $400 million in savings per year.
With a data strategy in hand, executives can further prioritize next efforts and build a plan.
Data from different resources won’t bring much value until it’s properly vetted and cleaned. The next step is to figure out the tools and processes needed to collect or create credible data sets, cleanse this data for further processing, and choose a reliable cloud-based storage.
Applixure, for example, deals with large volumes of data coming from different devices, software, and other touch points. Before it sends data to relevant dashboards, the system collects data from different sources, filters it, and further processes it according to user needs.
This step is important because it defines the quality of data at the output.
Data visualization can be a benefit on its own. At this step, data leadership determines how to configure data visualization tools, what parameters and variables to demonstrate and how to correlate different data streams to extract the best of value from given sets.
Virtualitics, for example, provides a wide range of ways to demonstrate data and allows its clients choose between hundreds of correlations depending on their goals in the immersive VR environment.
At this step, data already becomes visible and therefore brings the first value.
Analytics help businesses derive insights from data. This is the ultimate goal of the whole data initiative, because data insights allow executives to make data-driven decisions.
At this step, data leadership identifies the processes and tools for data analytics; decides whether to involve high-end technology such as machine learning; combines the efforts of data scientists and machine algorithms; or fully relies on existing data analytics tools or technology partners.
Demonstrating sessions length and the changing number of listeners could be relevant for Feed.fm clients, because it already provides the statistics on how the customers use the system. However, using advanced analytics reveals brand new opportunities and allowed Feed.fm clients to see what influences conversion and how to increase it.
The final step is important for the companies who want to uncover the deep impact of data on their business and take data-driven actions rather than simply monitor operations and processes.
Companies that invest in data analytics don't just save money or improve efficiency — they develop the organizational capability to make better decisions faster. That capability compounds: better data infrastructure enables better strategy, which enables better preparation and analysis, which enables the kind of decisions that drive sustainable growth.
The challenges are real — data quality, volume, and organizational readiness all take time to address. But the companies that work through them gain a durable advantage over competitors still operating on assumption.