
Why is Sustainable Architecture a Non-Negotiable Asset?
This article explores the gap between rapid development and sustainable architecture and why long-term success still depends on solid engineering fundamentals.
Updated February 3, 2026

Software development metrics are often disconnected from true business value for business leaders, where engineering dashboards may show work effort and product to be produced, yet do not give context on how those investments are creating faster time-to-market, lowered risk, and enablement of future growth for many companies.
Research consistently shows that companies that perform well when delivering software relative to their peers have a much higher level of success: Google published DORA, which indicated that companies with high performing teams are able to deploy code up to 208 times more often than low performers, and recover from outages 106 times faster than those companies with low performance. The clear advantage for these companies is faster innovation and improved customer service, combined with reduced operational risk.
The key challenge for leaders will not be only about what they can measure, but also about what will be the most meaningful measure for their business. This article outlines metrics for measuring and reporting on software development that enable a leader to align their engineering organisations with their overall business strategy and achieve a more predictable, sustainable software delivery process and product.
Looking for a Software Development agency?
Compare our list of top Software Development companies near you
Quantitative metrics determine how software is organized, developed, delivered, and governed throughout the Software Development Life Cycle (SDLC). The purpose of business metrics is to help create greater transparency for executives regarding delivery performance, quality, and effectiveness, not to monitor individual productivity.
Metrics work best when they are used to provide answers to questions at the executive level of decision-making such as:
It is important to separate outcome metrics from vanity metrics. The number of commits and lines of code, for example, typically does not correlate positively with business success, whereas delivery speed, quality, and impact provide executives with data to inform business decisions.
To ensure the clarity of reporting, from an executive perspective, grouping metrics by strategic categories is the most effective practice.
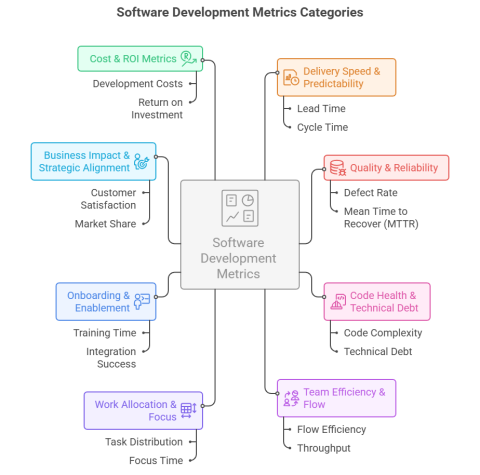
Below, we show you the categories of metrics that we believe should be the focus of executives in their businesses:
Delivery metrics demonstrate how quickly ideas go from the "conception" phase to the "customer" phase. Business executives use the delivery metrics to forecast time-to-market, forecast accuracy, & increase competitive agility.
Lead time, in the context of software, refers to the time it takes for an organisation's software code change to go into production.
Why Lead Time Is Important:
Short lead time enables an organisation to quickly react to customers' requirements and rapidly changing market conditions, including initiatives built using low-code or no-code platforms. DORA found that elite performers deliver speed and predictability with code changes within days, compared to low performers who may take up to months and weeks.
Example:
By eliminating the manual approval and testing steps, a SaaS organisation has been able to cut its lead time from 14 days down to 3 days and increase its capacity to continuously release new features, which customers can provide feedback on within a rapid time frame.
Cycle time is the time it takes to complete work (once it has begun), excluding any time spent waiting.
Reasons Cycle Time is Important:
When you have longer cycle times, that tends to indicate that there is internal friction somewhere (due to unclear requirements or too many people providing reviews), which causes your delivery to slow down, while at the same time not adding any value.
Insight into Business Cycle Time:
The faster you can reduce cycle time, the higher your throughput and the lower your headcount for the same amount of work. Cycle time can therefore be viewed as a very cost-effective way to scale delivery.
Deployment Frequency measures how frequently a software application or system gets released to production.
Reasons Why Deployment Frequency is Important:
Shipping small changes (more frequently) results in reducing your risks compared to shipping larger changes (less frequently). Instead of deploying multiple times per day as high-performing companies do, low-performing companies may only deploy one or two times every few weeks or even every few months.
As a result of higher Deployment Frequency, business leaders can test new ideas more quickly and continue to deliver consistent customer value with every release.
Having speed without stability is a risk. Through Quality Metrics, business leaders can understand if their software systems are reliable, maintainable, and trustworthy.
The number of bugs that have been added to production is the measure of defect rate, while the number of production defects is the measure of escape rate.
What it means to you:
IBM's research has shown that the difference in costs to fix the defect(s) during production as opposed to fixing the defect(s) during development can be 30x more expensive. Therefore, having a high escape rate, negatively impacts the cost of your support team and the trust that your customers have in your business.
Example:
The desire of a digital marketplace (e-commerce) to automate testing earlier in the development of their software will allow them to reduce production defects and ultimately lower the number of support tickets received from customers and reduce the amount of customers who are leaving.
MTTR is the time it takes for a system to return to service after failure.
What it means to you:
DORA studies have shown that an elite performing company can restore service to under one hour, while a low performing company may take days to weeks. In turn, faster recoveries lead to reduced revenue losses and a reduced negative impact on the reputation of the company.
Many metrics exist to allow you to measure the long-term health of a system, such as test coverage, code structure, and complexity or maintainability rating.
Business Impact of Technical Debt:
Poor technical health can have a negative impact on the maintenance costs and, in the future, the speed of development. According to McKinsey, a company's technical debt may amount to 40% or more of its IT balance sheet, which ultimately influences its overall profitability.
Team metrics allow team leaders to view team progress and determine how effective or efficient the team's efforts are in relation to the team's overall output without assigning productivity to each person in the team specifically.
While metrics provide structure and visibility, they should not eliminate human judgment. Some teams experiment with what is often referred to as vibe-driven development, an approach that emphasizes developer momentum, intuition, and team energy over rigid process adherence.
While this mindset can encourage creativity and engagement, it becomes most effective when supported by flow and throughput metrics that validate whether progress is truly being made. Metrics help ensure that positive momentum translates into consistent delivery rather than masked inefficiencies.
Throughput determines how much work has been completed over a particular period. Flow Efficiency measures the total time that any work item spends actually working.
What does this mean:
Research shows that in organizations, work is actively processed only 20% to 40% of the time, with the rest being held up waiting on something. Improving flow efficiency enables the production of larger amounts of work without additional cost.
Work Allocation Metrics measure how an engineering team distributes their effort among new features, maintenance, technical debt, and support.
What does this mean:
If the majority of your time is spent doing maintenance, then it is likely that there are underlying quality issues preventing you from creating new innovative ideas and growing your business.
Metrics like the Time to First Meaningful Contribution help determine the effectiveness of your onboarding process.
What does this mean:
The sooner you can onboard someone, the greater your return on investing in them and the lower your risk of not being able to deliver during times of growth.
The most beneficial metrics tie directly from engineering to business results, enabling communication of technical performance in the same vernacular that executive management uses.
Business Impact vs Engineering Work is a metric showing the total engineering effort that was put forth to support the growth of revenues, customer loyalty or strategic differentiation.
This information allows executives to ensure that the technical priorities of the organisation are in alignment with the company's overall goals and objectives - not just what needs to happen right now.
Delivery Predictability Metrics will allow the comparison of the estimated time of release to customers and the actual time it took to produce.
When an organisation can accurately estimate when its product will be ready for shipment, it can forecast more accurately and commit to its customers more reliably. This enables the organisation to establish stronger partnerships between divisions.
Cost and Return on Investment type metrics and comparison tools (for example, Cost of Each Release and Value Delivered for Each Iteration) provide leaders with the ability to evaluate whether the cost of an organisation's engineering investment is worth the return based on how much was spent or how many iterations of a product were required to create that value.
These metrics can be invaluable for making decisions about an organisation's scaling options or technology modernisation plans.
By using metrics developed in software development, executives are provided with an organised way to evaluate methods and delivery quality without being bogged down by excessive technical details. Thus, having a more focused, easier to understand number of things that really matter - how quickly, how well, how efficiently and what will be the result.
By analyzing the time required to develop a product, how often products are released, and how many products have defects after release, a SaaS provider identified which parts of its delivery process were causing delays.
The analysis showed that the cause of delivery delays was mainly due to long approval processes and the fact that testing was being done by hand very late in the delivery process, which caused delays in getting the products out to their customers.
By changing the way approvals were handled, putting more focus on writing automated tests early in the development process, and releasing products more often but at smaller volumes, the SaaS company was able to eliminate much of the time wasted on delivery and to make greater use of each product as it was released, thus improving customer satisfaction and increasing confidence among stakeholders.
A professional services provider also looked into how their engineers were spending their time and found that too much of that time was being spent on maintenance and correcting defects that were unexpected defects.
Instead of increasing staff levels to cover these areas, the professional services provider decided to invest time and money in a plan to eliminate its technical debt through targeted refactoring.
With time, this initiative enabled the engineering department to reduce its ongoing maintenance costs, provide greater stability to the systems it supports, and allow their engineering teams to have more time to dedicate to high-value projects that drive business growth.
Before actually selecting your metrics, it is very important to determine what you are trying to accomplish. A great place to begin selecting metrics is to define a set of business goals you are optimizing for.
By selecting a balanced set of measures for regular tracking rather than acting in response to the latest trends, you can focus beyond short-term performance fluctuations and gain insight into longer-term patterns that reflect the evolving practices in modern software development.
High-performing organisations have been known to follow common frameworks such as DORA and SPACE, both of which offer a way to construct metrics with systemic balance; they promote the use of metrics in context rather than optimizing on a single metric, which can lead to the loss of systemic health.
When choosing metrics, it's a best practice to:
The ultimate reason for the metrics collected in Software Development is to improve decision-making. Carefully selecting metrics and continually reviewing them will enable organisations to identify opportunities to align Engineering with other areas of the organisation.
Many organizations make the mistake of focusing on activities rather than results when creating metrics. Although metrics like the number of commits, tickets closed, or hours worked may show productivity to some degree, they do not always reflect the value created.
Another mistake organizations often make is creating metrics to compare or evaluate individuals rather than groups. This practice does not promote transparency and encourages individuals to "game" the system rather than focus on improving processes. Metrics are most useful when viewed at the group or system level.
Another serious mistake is to ignore context. A metric that presents a risk factor in one context (e.g., a small team) may be perfectly acceptable in a different context (e.g., a larger team), depending on factors such as the maturity of the product, the size of the team, or the nature of the industry in which it operates.
Some of the major pitfalls to avoid when creating performance metrics:
When the measures of performance are not understood and/or have not been used in the productivity mythscorrect manner, they can lead to confusion and lack of clarity, but when used in the correct manner, measures of performance have the potential to be a highly effective organizational tool for leaders in the enhancement of systems, outcomes, and the potential of the team's inherent performance.
The modern software development ecosystem provides an easy way to obtain accurate software metrics through CI/CD (Continuous Integration and Delivery) tools, Project Management Tools, and Observability Tools. By using these tools correctly, the data generated can be converted into useful insights.
Data alone, however, is not sufficient for business leaders to understand software trends. Clear visuals will assist business professionals to quickly identify and perceive the trends and patterns within the data, as well as to reduce the technical depth required to interpret the data. By using the correct form of Visual initially, managers will also reduce their cognitive loads, allowing them to make decisions faster.
Examples of Effective Executive Visuals include:
Finally, when you combine these items with meaningful knowledge of how to use them( best obtained through regular review), a business professional will make informed and confident decisions about the delivery of their software applications.
Software development metrics become valuable when combined with business outcomes. This enables leaders to better predict outcomes, reduce their risk of making poor decisions, and increase the likelihood that they receive real value from their technology investment by applying speed, quality, efficiency, and the strategic impact of delivery.
By properly selecting and responsibly using software metrics, businesses can achieve not only an understanding of current delivery capabilities, but a competitive edge over other organizations.