
AI-Assisted Software Development: Productivity Gains vs. Quality Risks
AI-assisted software development has already become the everyday practice for the majority of development agencies. This article dives into its benefits and...
Updated November 4, 2025

Most performance failures start with small signals that no one takes seriously. This piece looks at the cost of ignored signals and how a preventive mindset turns system stability into a leadership advantage.
How many of us really expect performance issues to show up exactly where we’ve planned for them? We already know that bottlenecks are part of the game; that’s why we use load testing, monitoring, and simulation. However, even with mature processes in place, some issues still slip through.
These are the ones that don't show symptoms until they break something under pressure. The response is usually the same: everything else gets paused while the team scrambles to fix it fast, which inevitably drives up the cost. What makes it worse is the timing, as these issues show up when they’re least expected or when their impact is hardest to contain. And that’s when the losses go far beyond just the engineering effort.
Looking for a Software Development agency?
Compare our list of top Software Development companies near you
The first hit is revenue. In high-load ecommerce setups, where every millisecond translates into sales, a slowdown in checkout or a stalled promotion flow can easily turn into customers dropping off mid-purchase.
Then, on the list are small latency spikes that can snowball into thousands of failed transactions when traffic is surging. What follows is predictable: support queues grow, refunds increase, and customer trust takes a hit.

Behind the scenes, engineers are pulled from planned work to patch production under pressure, delivery timelines slip, and release pipelines stall. Every hour spent firefighting is one not spent improving the product.
While the financial and operational fallout is easy to measure, the root cause often isn’t. By the time the team puts out the fire, the question isn’t just what failed, but how it was allowed to build up unnoticed.
From experience, I know that performance degradation rarely happens overnight. It’s the slow consequence of small inefficiencies scattered across different layers of the platform and routine work that feels harmless. All these add a little weight until one day the platform feels slower, less reliable, and harder to change than it should.
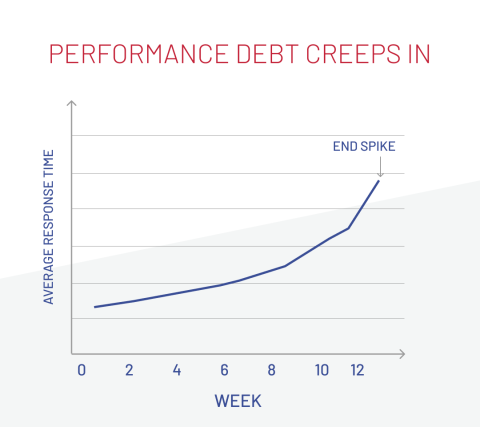
The graph illustrates how small inefficiencies quietly build up over time, slowly increasing response times. What looks like a "sudden spike" is actually the visible result of that gradual accumulation finally reaching its tipping point.
That’s how debt creeps in:
Performance debt grows this way: through dozens of tiny compromises that no one intends. And the first step toward changing that is learning to spot the early signs before they turn into emergencies.
Fortunately, performance debt rarely arrives without warning. It leaves early hints that something isn’t quite right. Those signals give you a window to act before the snowball hits the system. The questions below can help focus attention on the indicators that matter.
The data behind these questions already exists in dashboards, logs, and analytics tools that executives rarely see in context. Spotting the trend lines early separates healthy systems from reactive ones, and a preventive operating model is designed to avoid that.
By the time a system slows down, it’s already too late to call it preventive. True resilience is built through habits that make surprises rare in the first place. That’s why a preventive operating model focuses on shifting performance from a firefighting problem to a managed discipline.
You can’t prevent what you can’t see. That’s why observability should be part of the architecture from day one. Collecting metrics, traces, and logs across services allows teams to detect anomalies early and understand the root cause before they escalate. Teams spend less time explaining failures and more time improving what works.
Besides being a technical metric, performance also measures user patience. Regular benchmarking of page load and response times helps ensure that growth, feature releases, and seasonal peaks don’t quietly erode user satisfaction.
On one high-traffic retail platform, continuous monitoring revealed gradual slowdowns on product and cart pages. The issue was missed in functional tests, but my team was able to resolve it early thanks to comparing benchmark results against defined performance targets.
When demand spikes, resilience determines whether a system slows gracefully or collapses publicly. Designing for controlled degradation, where noncritical features pause to keep core flows alive, protects revenue and reputation during unexpected load. It also gives engineering teams breathing room to manage the surge without risking outages or reactive rollbacks.
Regular refactoring keeps systems adaptable, ensuring today’s quick fixes don’t become tomorrow’s bottlenecks. It’s less about rewriting code and more about maintaining the capacity to evolve without breaking speed or stability. Teams that treat refactoring as routine maintenance rarely find themselves paying the interest of past shortcuts.
Monitoring server response times is useful, but performance also lives in the user’s browser. Real User Monitoring (RUM) and Core Web Vitals show how fast the site actually feels, not just how fast it runs. They uncover subtle lags, such as layout shifts or delayed interactivity, that silently affect engagement before traditional metrics flag a problem.
Load testing shouldn’t be a special event before a major release, but a part of the delivery rhythm. Automated load simulations validate performance after every significant change, revealing weak points while there’s still time to fix them. This approach lets teams scale features confidently, knowing that delivery speed doesn’t come at the cost of stability.
A preventive model works when it becomes part of everyday operations. The next step is translating these practices into leadership choices.
So, if your goal is to stop overpaying in resources and team effort for reactive performance fixes, the shift doesn’t have to start with a grand transformation. It can begin with subtle adjustments in how priorities are set and where attention goes.
Performance holds up when people stay curious about how their systems behave. You don’t need heroics, just the habit of noticing small shifts before they turn into patterns. When you build that kind of awareness into everyday work, the pressure changes too.
Teams stop chasing fires, leadership stops waiting for postmortems, and the whole system starts feeling lighter. That’s what a preventive mindset really gives you: the space to grow without breaking what already works.