
5 Tips for Small Businesses Filing Their Taxes
Tax season is right around the corner — partnerships, LLCs, and S-Corporations are expected to file by March 14, 2024, while C-Corporations have until...
Updated December 5, 2024

You’ll be able to maximize your financial investments and solidify your decision-making by organizing your information and knowing how to track stocks in Excel. The calculation power of the program can produce many insights with a small amount of data.
Updated 03/29/2022
The stock market presents a congested field of stock picks that can be challenging to manage.
Looking for a Accounting agency?
Compare our list of top Accounting companies near you
Especially given the high volatility of the market in recent years, it's more important than ever to do your due diligence when investing. With an Excel spreadsheet, however, you can successfully manage your stock portfolio for data-based decision-making.
Gorilla Trades is the #1 stock-picking service in the world with over 20 years of experience for the modern investor. Becoming a savvy investor begins with organizing your spreadsheet, where we examine the following, all in one place:
When figures are organized, you’ll get to weigh your previous investments and observe and study investment patterns.
Tracking investments in Excel may appear complicated, but it's worth the investment to have all your information in one place. You'll find your stock portfolio easier to manage after taking the following steps to track stock trading:
The inclusion of each of these 5 components in your personal Excel stock tracker will have you well on your way to managing your investments yourself.
A successful Excel spreadsheet begins with recording basic data. We recommend using one line for each stock category and writing each category in separate columns.
As you fill in each column, every cell will be conveniently filled in by data provided by your brokerage firm. However, if you are planning to buy more shares of the same stock at a new price, create a new row and record it there to avoid confusion.
Organizing stock pick information in a spreadsheet helps simplify break-even evaluations as well.
The next move is to create another column to assess the existing information and determine a break-even formula, which identifies the price of sale necessary to achieve a net income of zero.
Label this column “Break-Even Price.” Directly below this column, input all of the stocks you are monitoring and use the following formula:
= (((Buying Price*Shares Purchased+(Commission*2))/Shares Purchased)-Tax Rate*Buying Price)/(1-Tax Rate)
For each variable, you can input the exact numbers from the data you have previously gathered or build the formula through cell references.
The category, “Buying Price”, is the amount you paid per share of a particular stock. Meanwhile, “Shares Purchased” is the total number of shares you purchased, “Commission” is the amount you’ll be paying to the brokerage service when you buy or sell a stock.
The image below is a representation of the number of shares purchased, the stock's buying price, and the commission. As you can see, the total differs for each category, before a break-even is calculated.
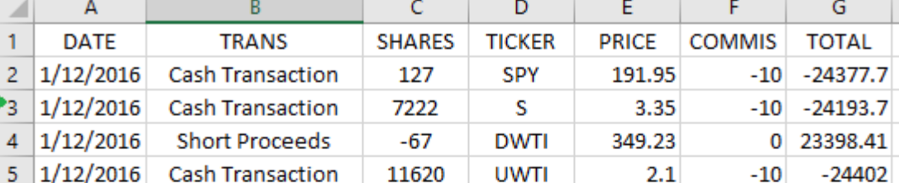
According to the formula, the “Commission” category will generate as, "Commission*2". This is because you will be paying the commission twice: once when buying and the other one when selling.
The “Tax Rate” category (not shown in the picture) denotes the status of every stock in a given year. This category can be calculated in two ways:
If you want, you may also include the state income tax rate.
After inputting all data, Excel will calculate the solution for a particular stock and the answer will generate your break-even point for that stock.
Strategically calculating a break-even is integral to determining what selling price you should aim for.
Apart from the profits and the losses of stock, you should also aim to track the dividends paid out.
You can start by creating a new worksheet and adding the following columns:
By keeping a strong record of any losses or profits, you can better track the number of dividends expected on your end.
If you are going to sell your stock, calculating capital gains is sure to put you on the right track.
Give special attention to both short-term and long-term gains to calculate them on your own, so you can compare them to the results given by your brokerage firm.
Excel simplifies this process and keeps it all in one place. Start by creating a new worksheet and adding seven columns with the following categories:
In fact, you can get the information on the purchase price by looking at your original stock tracking worksheet.
Use the formula below to calculate your capital gains:
(Selling Price - Purchase Price)*Shares Sold
The below image indicates the purchase price, P1, which is subtracted from the initial selling price, P0. The table uses the appropriate cell blocks, 6 and 7, to complete the capital gains formula.
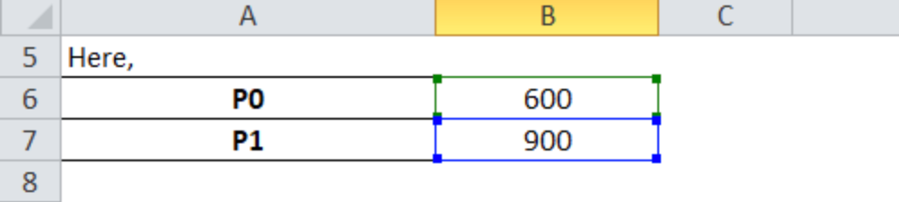
A negative result signifies capital losses.
For every sale, indicate whether it was a short-term gain (stock held for less than a year) or a long-term gain (stock held for one year or more). You can then compare your results with the expected results given by your brokerage firm.
Assessing your capital gains in Excel will clarify any profits or losses you may experience, empowering you to make the best decision for yourself.
Even if you don’t own a specific stock yet, Excel is a great tool if you are planning to buy some in the future.
Let’s say you find a stock that you’re considering buying — just add it to your list to keep track of all of your prospective stocks. Don’t forget to include:
The target buying price is particularly important and ensures that you are introducing the stock into your portfolio at the most advantageous times possible.
By keeping an eye out on future stocks, you can better prepare yourself to integrate them into your current stock portfolio.
All in all, maintaining Excel spreadsheets of current and potential stocks in your portfolio puts you on the path to success.
Recording basic data, calculating a break-even, tracking dividends, formulating capital gains, and documenting prospective stocks will help you make the best decisions possible.
I am a marketer and writer. A writer by day and a reader by night as, a big music lover and foodie. When I am not doing all these, I try new things.
See full profile
![How to Create a Budget for Accounting Services [With Template]](https://img.shgstatic.com/clutch-static-prod/image/resize/715x400/s3fs-public/article/7dce8a5e1339227e397cf68f6f555f92.png)